Troy D. Abel (Huxley College of the Environment on the Peninsulas, Western Washington University)
Jonah White (Department of Geography, Michigan State University)
Stacy Clauson (Department of Environmental Studies, Western Washington University)
Emilio’s voice cracked in response to our air pollution experience question. He’s one of Seattle’s thousands of soccer dads. Emilio recounted smelling and tasting metallic emissions as his son practiced in the Duwamish River Valley’s Georgetown neighborhood. That voice carried both anguish and fear for a father living and playing in a different Seattle where small industries, railroad tracks, an interstate, and their pollution shared a border with his child’s playground.
He and several other South Seattle residents shared their worrisome stories about living and playing on this “Emerald City’s” southside during our research team’s fieldwork in 2015. We use pseudonyms to protect their identities.
Emilio also feared that emissions from industrial facilities and truck traffic in his neighborhood will worsen the health of his son, who like many Duwamish Valley children, suffer from asthma. Conversely, Blake and his family live in Ballard on Seattle’s Northside. They often play at Golden Gardens, a waterfront park where children run on sandy beaches or explore tide pools. Blake doesn’t worry about air toxic exposure for his family. Childhood asthma rates in North Seattle are three times lower than the Duwamish Valley.
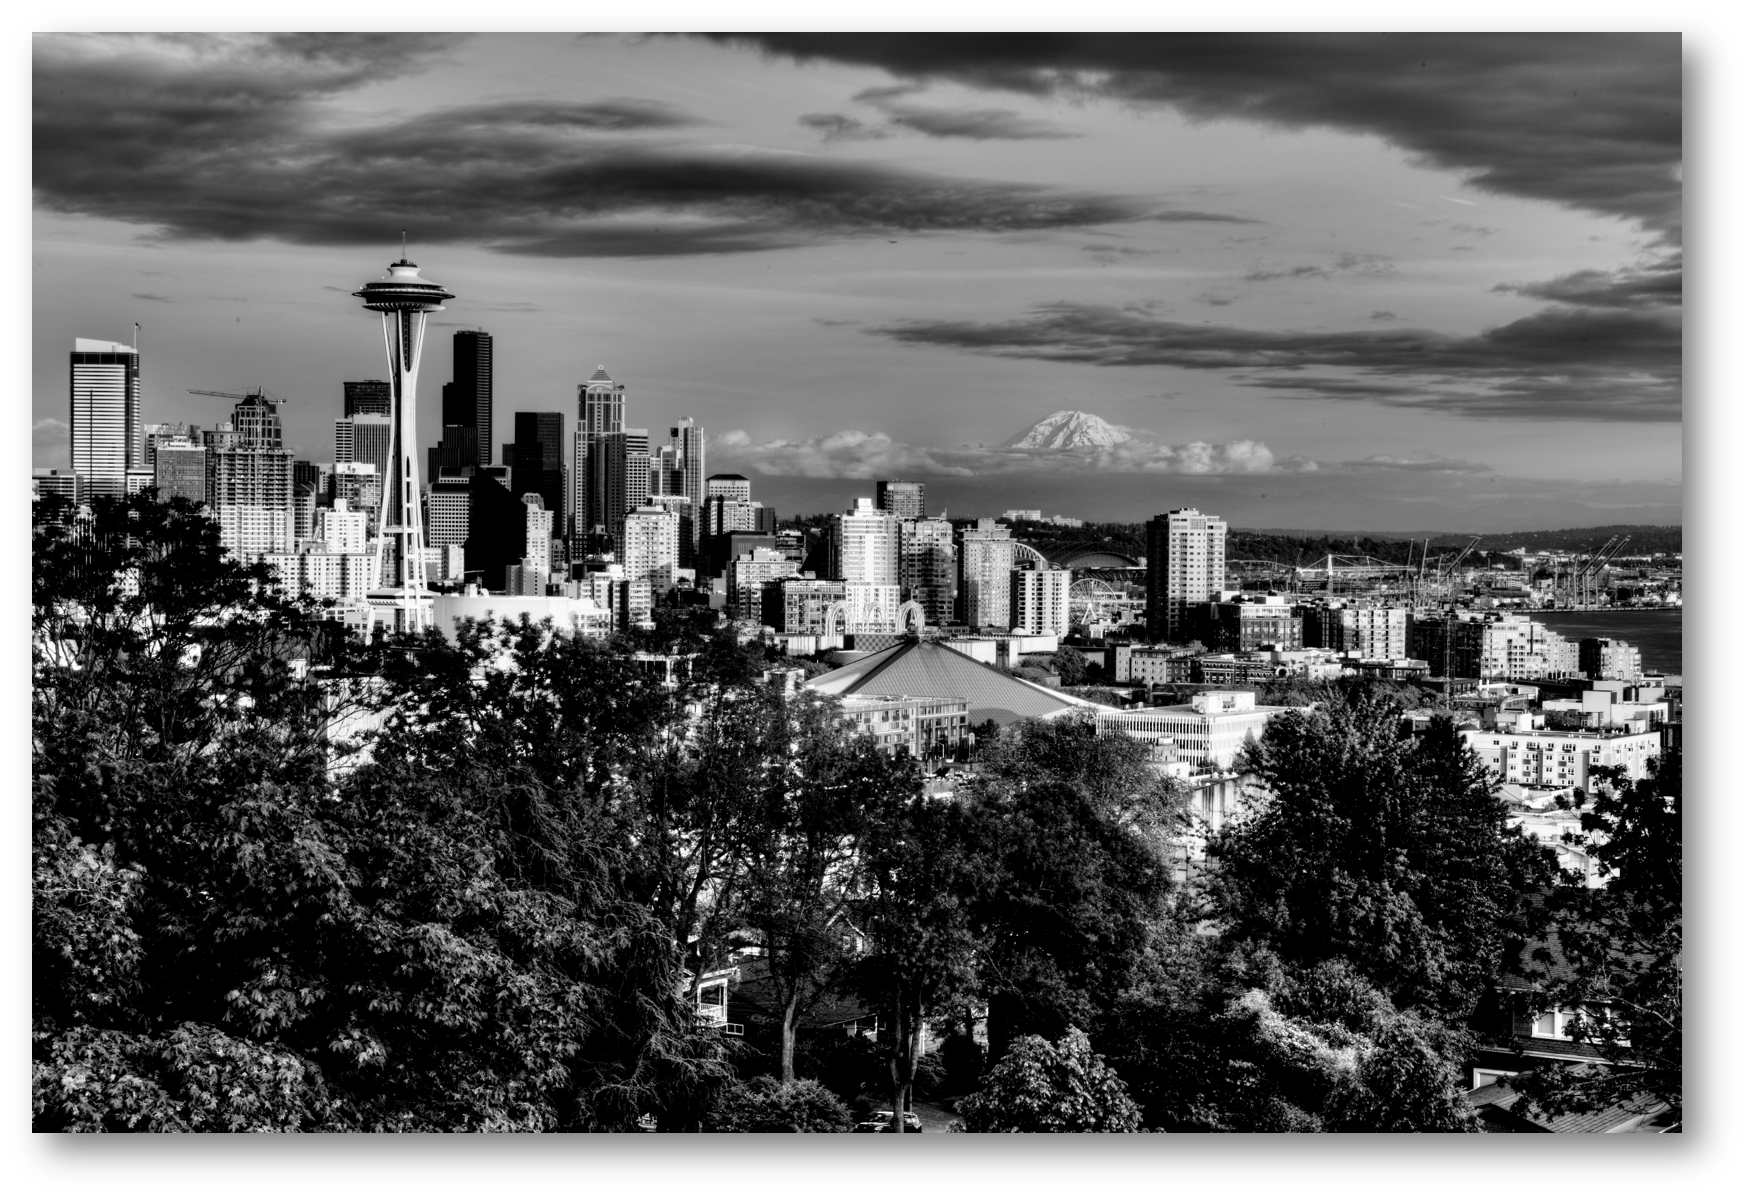
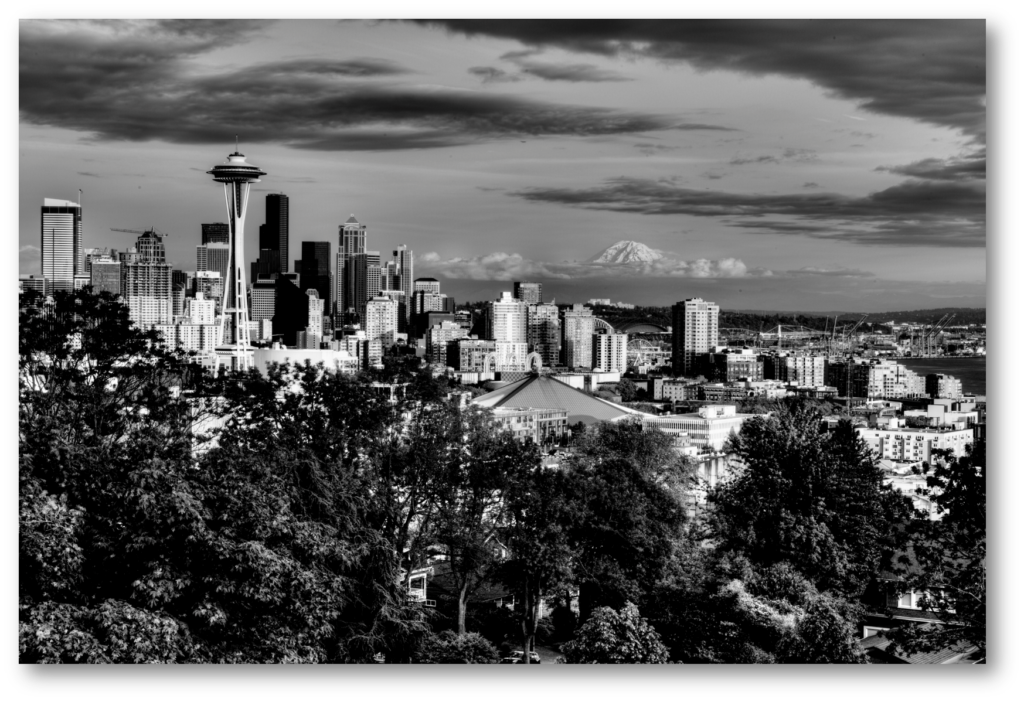
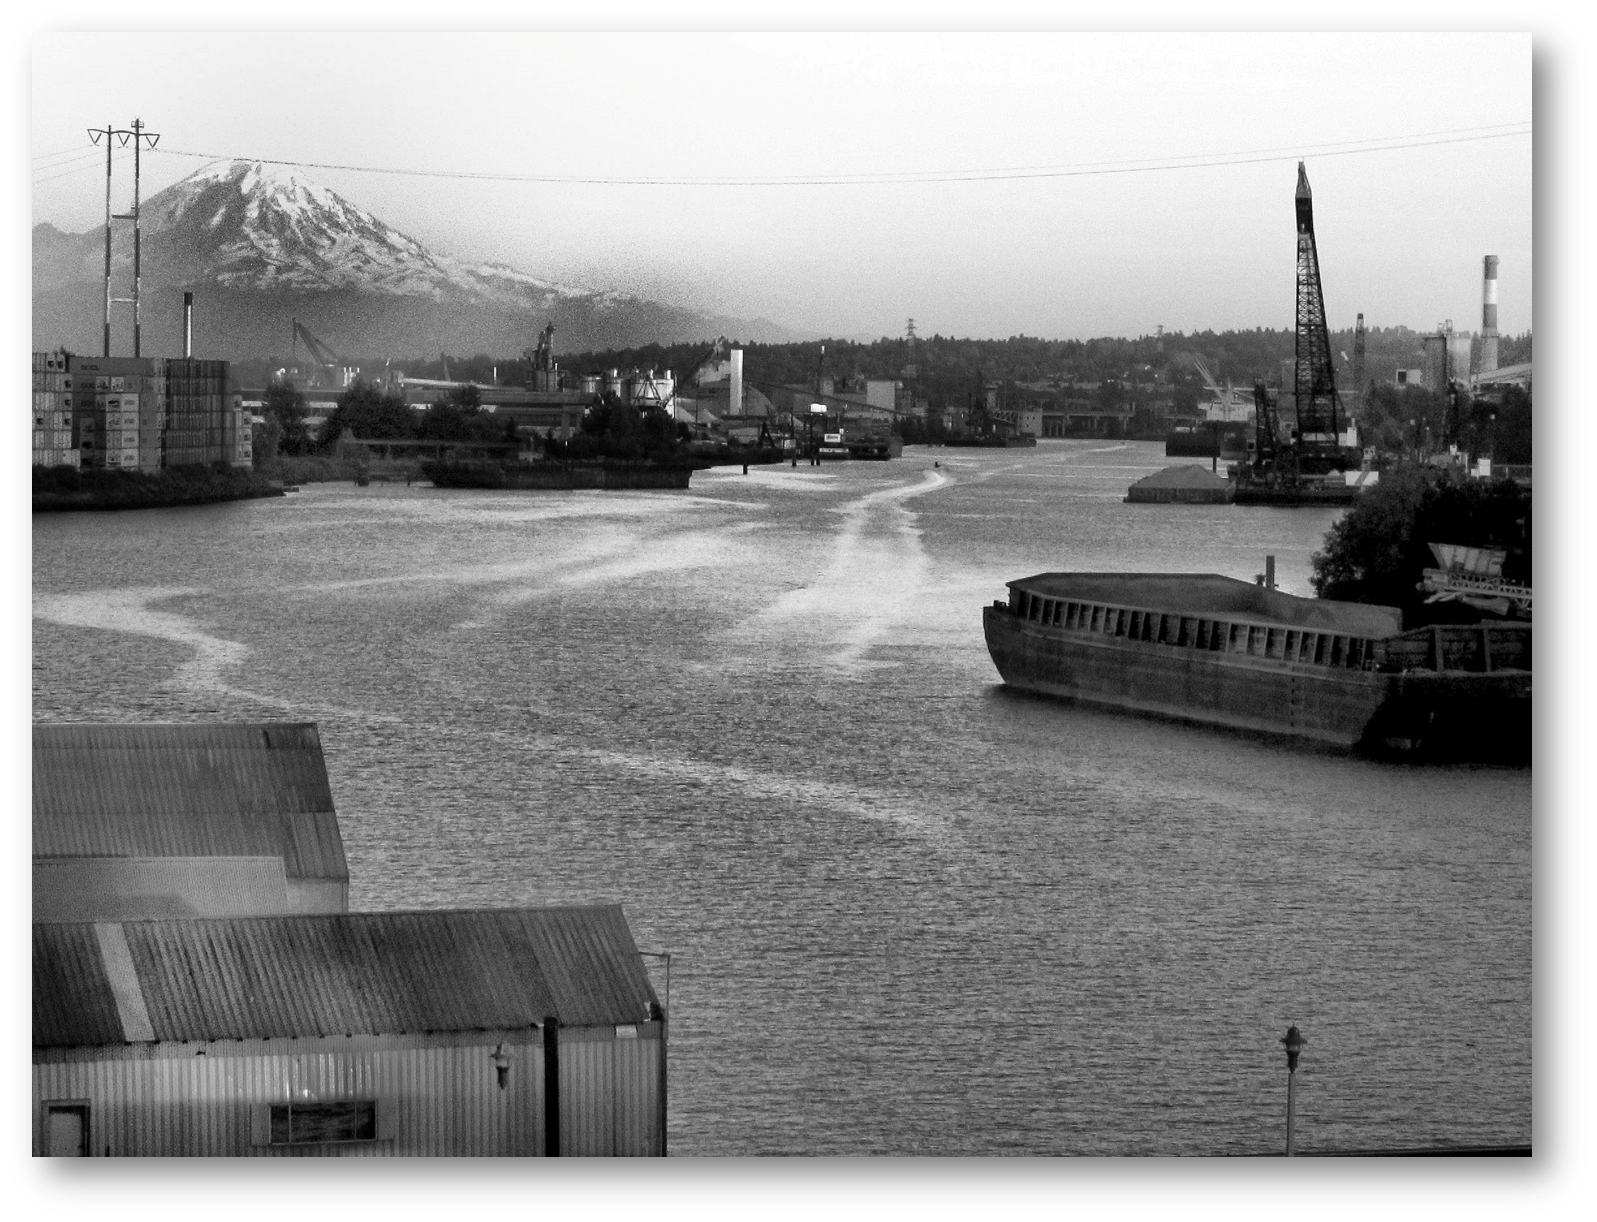
Most Seattle residents and visitors often marvel at Seattle’s waterfronts, the surrounding evergreen forests, and views of snow-capped mountains. The iconic Seattle view above includes landmarks like the Space Needle and downtown juxtaposed against Mt. Rainer on the horizon. But, many don’t see or ignore one of Seattle’s most important yet polluted landscapes. The Duwamish River and its valley on the city’s south side forms the industrial heartland of the city. It’s also the center of Seattle’s segregated riskscape.
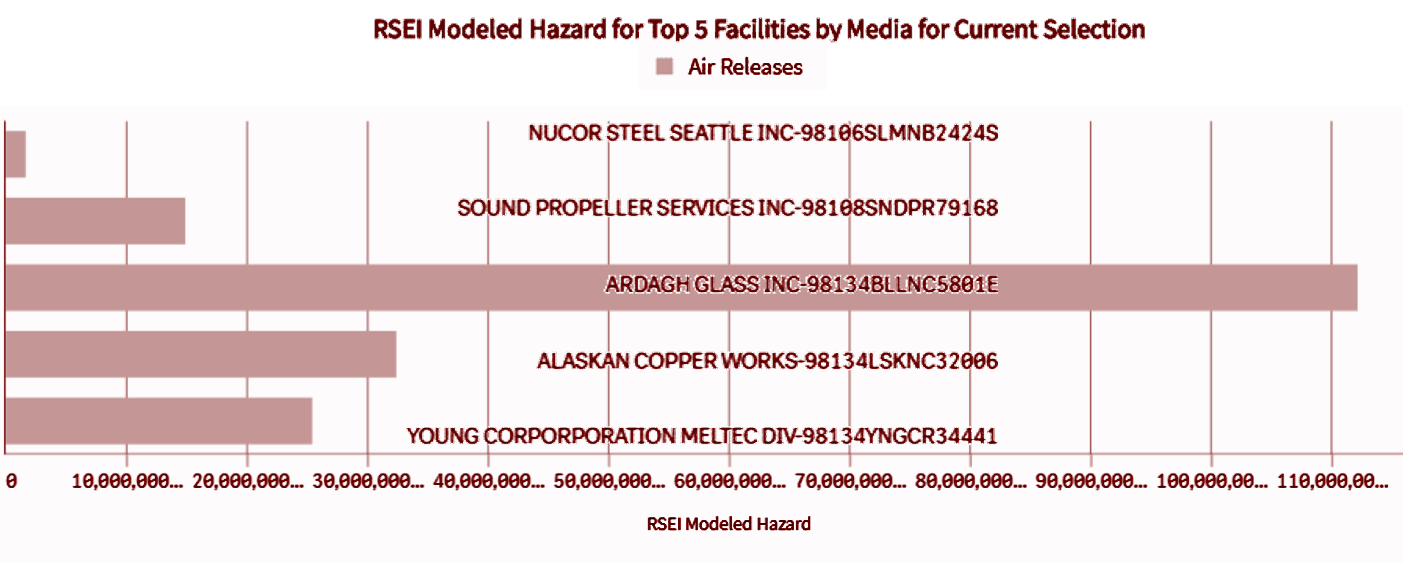
For the decade from 2006 to 2016, 51 industrial facilities reported toxic emissions totaling over 392 million pounds according to data compiled by the US Environmental Protection Agency (EPA 2019). But, not all toxic air pollution is created equally (Abel 2008) and three of the smallest polluters by volume of emissions accounted for ninety percent of the city’s relative risk for simulated inhalation exposures from toxic air emissions (EPA 2019). Ardagh Glass, Alaskan Copper Works, and Young Corporation each emitted less than 60 thousand pounds of pollution, or just 0.03 percent of the city’s total, but they emitted some of the most toxic industrial air emissions like the Persistant Bioaccumlative Toxins (PBTs) chromium and lead. Therefore, South Seattle residents like Emilio now face a disproportionate share of the city’s pollution risks. Conversely, northside residents face far fewer environmental hazards. How did Seattle’s riskscape become so skewed?
A Tale of Two Emerald Cities
Seattle has been heralded for its sustainability, but its segregating reality challenges this reputation. Many parts of the city are flourishing with vibrant green spaces, good jobs and safe and secure housing. However, other parts of the city have fared much worse, with unsafe housing conditions, deteriorating air quality, and economic insecurity. The South Seattle neighborhoods of Georgetown and South Park in particular are on the highest end of the air pollution risk gradient and the lower end of the socioeconomic status (SES) and health gradient.
This post summarizes our research program on Seattle as a case study of environmental gentrification. We examine how rich households capture more of the benefits of a cleaner and more sustainable urban environment. Poorer residents become worse off. Gentrification is a growing challenge for Seattle. The equity and social impacts associated with land use competition are an increasing concern for many residents who face displacement pressures.
Fueling this competition, on the one hand, is the city’s shift toward a postindustrial, knowledge-based economy where well-paid, highly-educated “creative class” workers outcompete service and working class residents for urban amenities like cleaner air and natural areas like parks and waterfronts. On the other hand, the commitment on the part of city officials and policy makers to creating a clean, green and sustainable city also contributes to increased competition over urban space. While Seattle is an environmental leader among North American cities, the city’s river is the center of an Environmental Justice (EJ) struggle few recognize. Since 2007, researchers at Western Washington University have been studying Seattle’s invisible riskscape as a case study of environmental injustice.
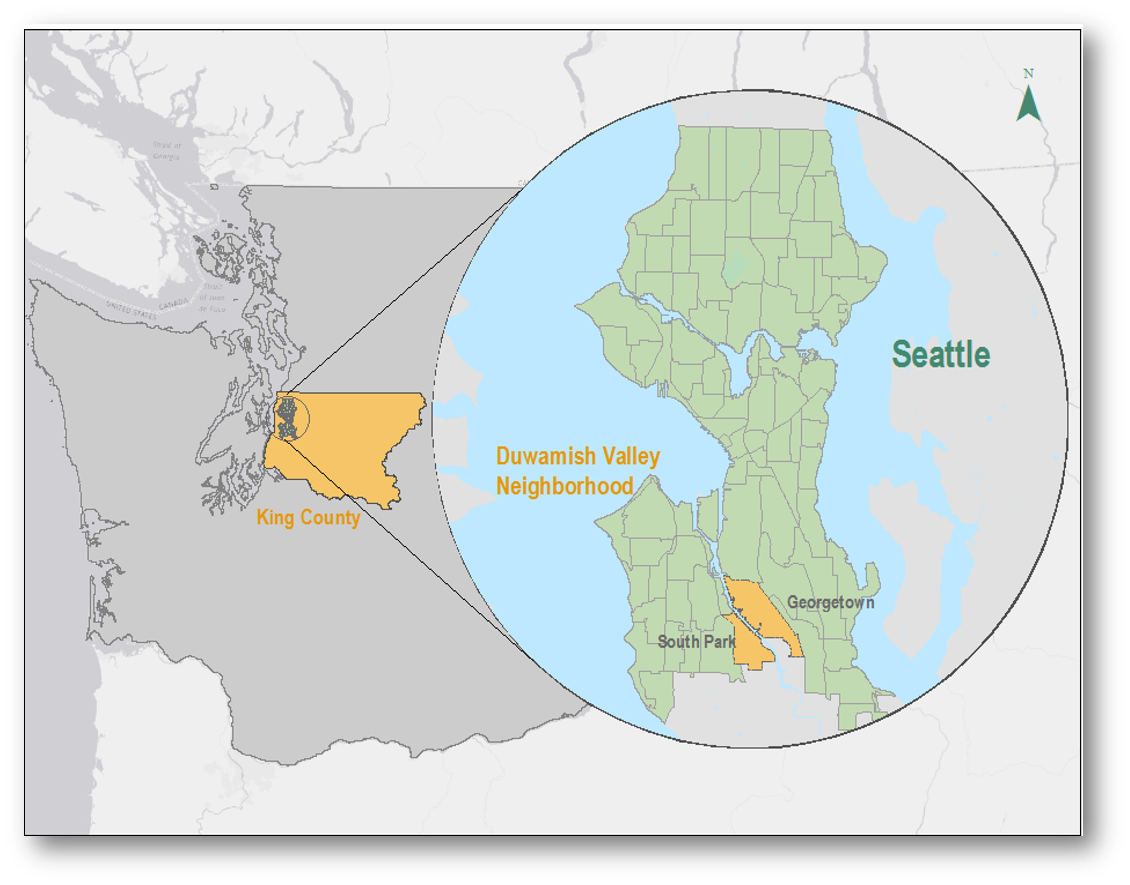
Environmental injustice is the result of the unfair treatment and meaningless involvement of people because of their race, color, national origin, or income with respect to the development, implementation, and enforcement of environmental laws, regulations, and policies. These injustices and patterns of environmental disparities have long been recognized in the US, but South Seattle trends also illustrate how these are intertwined with economic inequality and social segregation.
We found that both residential and industrial mobility contribute to a segregated riskscape of concentrated environmental advantages and burdens. Our combined application of the environmental science of relative-risk screening and geographic social science in a longitudinal analysis revealed Seattle’s complicated yet intersecting trajectories of environmental inequality formation and socioeconomic stratification. Such historical considerations will be a crucial input in the larger research task of assessing urban sustainability and its health dimensions in the future. The Seattle case exemplifies the process of environmental inequality formation and joins the extensive EJ literature documenting urban environmental and health injustices across the United States.
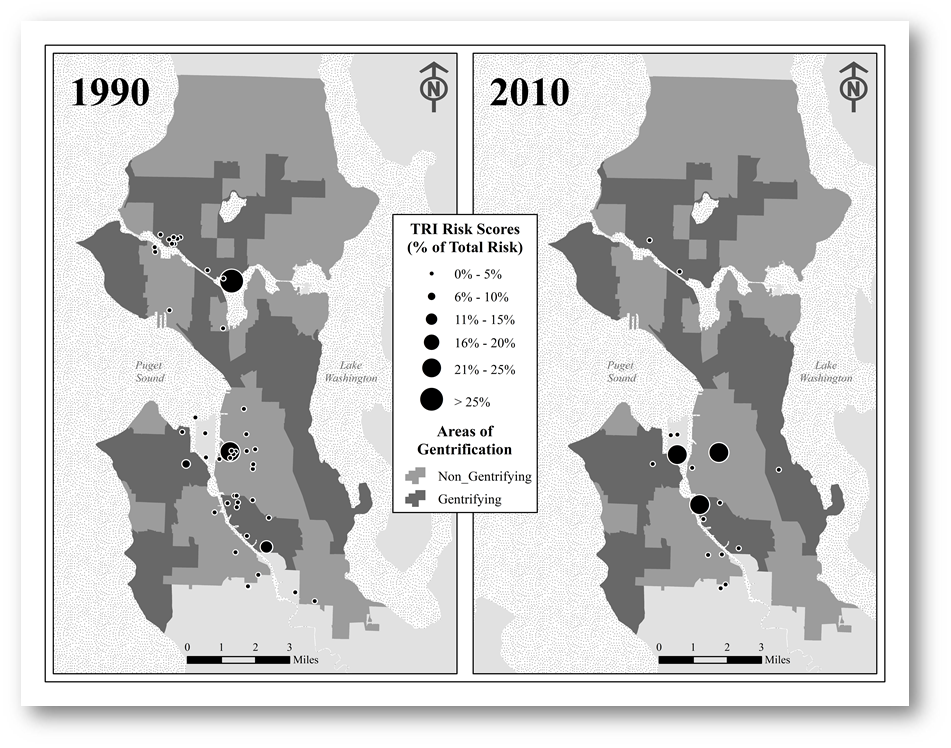
In 1990, according to the US Environmental Protection Agency’s Toxics Release Inventory (TRI) and the Risk Screening Environmental Indicators (RSEI), Seattle’s air toxics exposure risk from industrial facilities was almost equally split between the industrial zones of Ballard and Interbay in the north, and the Duwamish River Valley on the city’s Southside (49 – 51%). Yet, industrial facilities in the Duwamish Valley outnumbered Ballard and Interbay sites by three to one. By 2010, South Seattle polluters outnumbered those on the Northside by six to one. Facilities in South Seattle also accounted for more than 95% of the air toxic pollution risk burden by 2010. Industry and its pollution is being gentrified out of North Seattle while concentrating in the Duwamish River Valley.
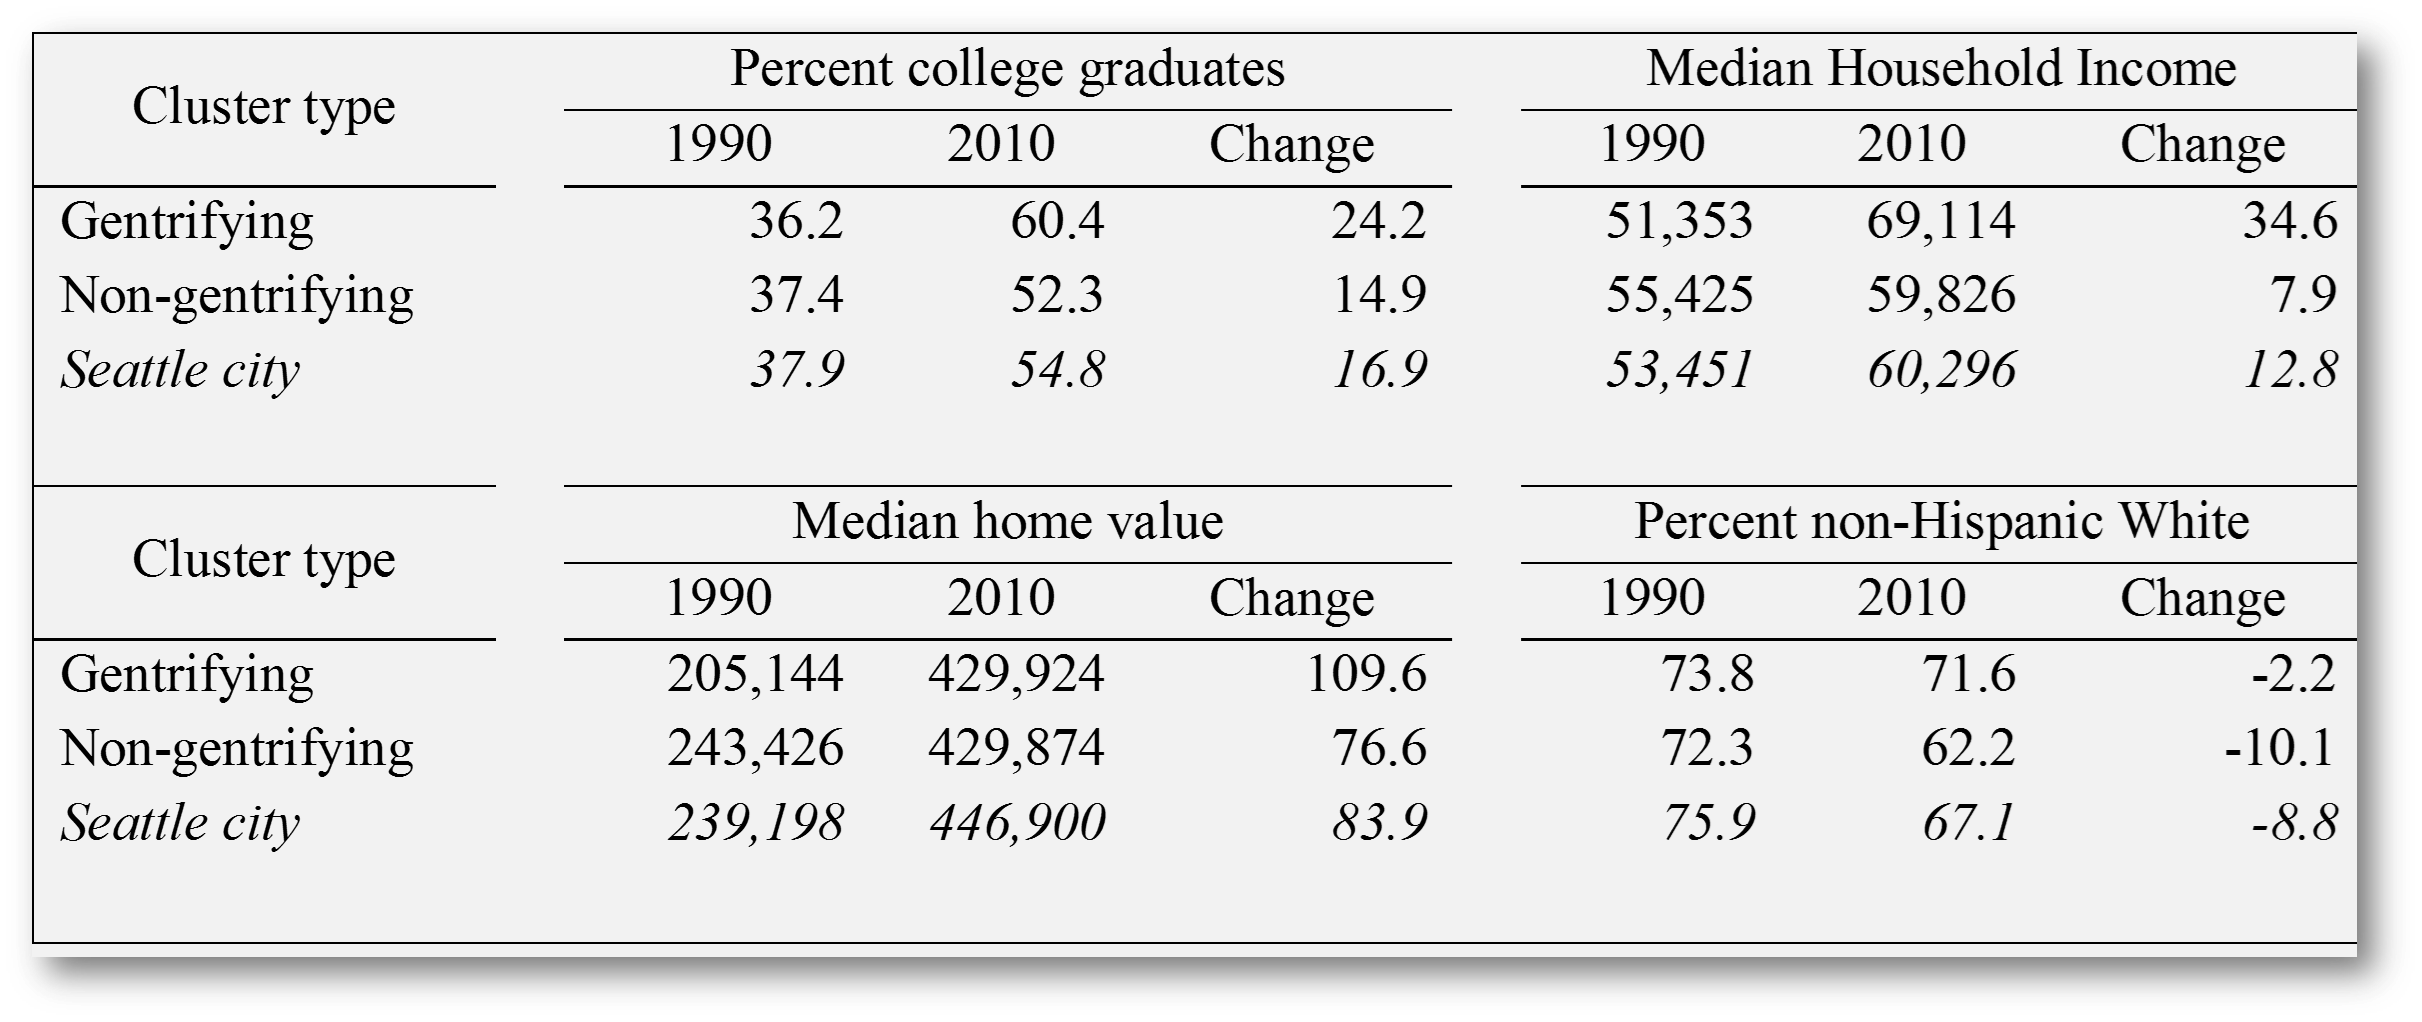
Seattle’s socioeconomic divisions also are skewing. The 1990 median household income and home values were higher in non-gentrifying areas but over two decades, incomes and home values grew much faster in gentrifying areas. Whites fled non-gentrifying areas more rapidly while college graduates concentrated in gentrifying areas. In the Georgetown and South Park neighborhoods, median house values were $100k lower than the city average in 2009 while poverty levels climbed from 1990.
Concentrating Disadvantage
Moreover, since 2010, Duwamish Valley facilities in the 98134 zip code increased their air emissions. Similar to these worrisome industrial air pollution trends, other researchers find that transportation pollution also is skewed in South Seattle. For instance, the regional air quality agency attributed 70% of the extra cancer risk to Diesel PM in South Seattle (PSCAA).
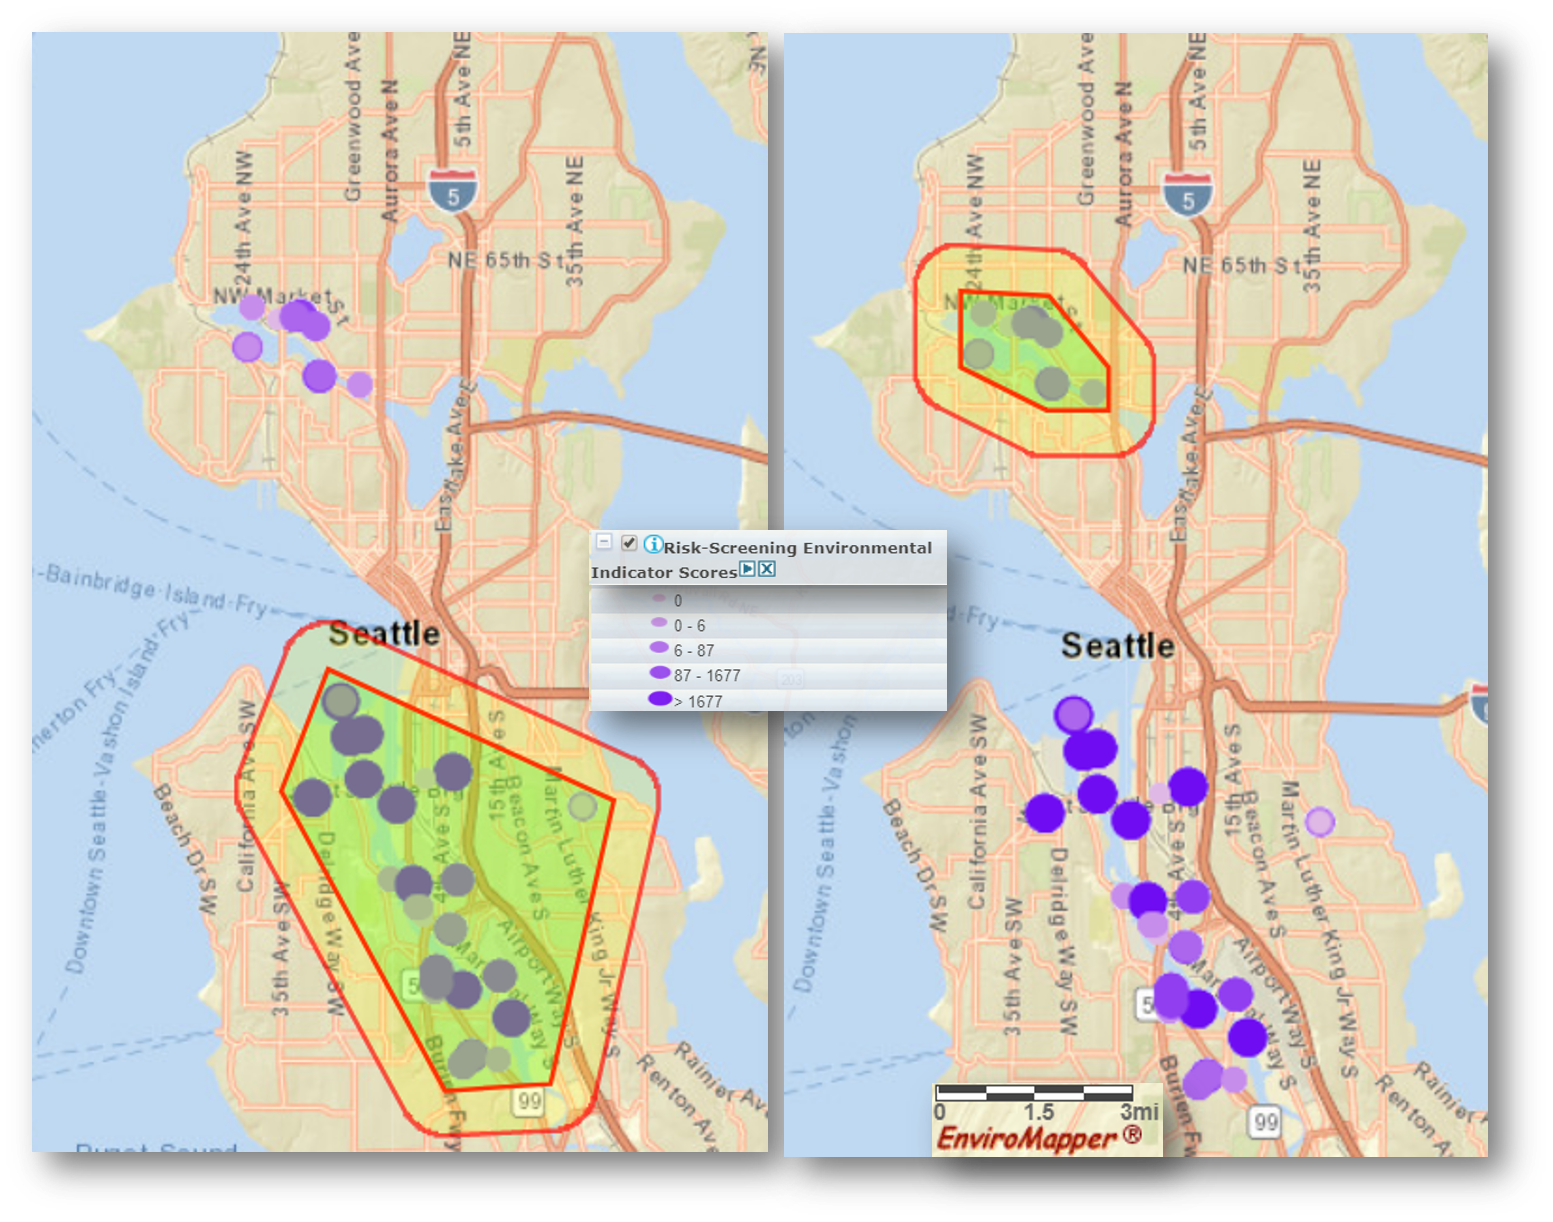
But, Seattle’s segregated riskscape clearest illumination comes with our application of the EPA’s new EJ Screen tool (https://ejscreen.epa.gov/mapper/). We created polygons encompassing Seattle’s two clusters of industrial facilities seen in the map above. Twenty-two facilities appeared in South Seattle’s Greater Duwamish Manufacturing Industrial Center (GDMIC) polygon and 1 km buffer along with a population of 101,814. This cluster scored in the ninetieth percentile or higher in the state of Washington for some of the worst levels of diesel Particulate Matter (PM), Respiratory Hazards, Traffic Proximity and Volume, Superfund site proximity, and Hazardous waste facility proximity. The GDMIC area’s minority population exceeded 58 percent placing it in the 89th percentile for the state. Thirty-five percent of the area’s population also were low-income while eleven percent were linguistically isolated.
Conversely, only eight facilities were located in North Seattle’s Ballard and Interbay Manufacturing and Industrial Center (BINMIC). This cluster saw none of its EJSCREEN measures exceed the 25th percentile for the state. Moreover, only 18% of the BINMIC cluster’s population of 74,445 were minority, just 16% were low income, and one percent were linguistically isolated. Seattle’s segregated riskscape results in many more minority and low-income residents being exposed to toxic industrial air emissions, diesel PM pollution, and higher emissions from greater traffic volumes. Such disparities illustrate the segregation of Seattle into two Emerald Cities.
Many EJ studies and official statistics tend to emphasize regional trends and aggregations. These perspectives obscure a class of toxic outliers and super-polluters that disproportionately burden low income and nonwhite communities with the worst of the worst chemical emissions. We join a growing body of research that reveals America’s skewed industrial riskscapes, linking it to the sociohistorical restructuring of Seattle’s land use patterns and its segregated spaces. Socioeconomic inequalities and pollution disparities are worsening for Duwamish Valley residents.
The Seattle-King County Conventions Bureau adopted “Emerald City” as marketing slogan in 1982 when a California writer won a contest with the following submission. “Seattle, the Emerald City. Seattle is the jewel of the Northwest, the queen of the Evergreen State, the many-faceted city of space, elegance, magic and beauty.” In his environmental history of the city, Matthew Klingle attributed this slogan as one source for the title of his 2007 book. The imaginary metropolis in L. Frank Baum’s The Wizard of Oz was the second source. Among the core questions at the heart of Kingle’s book was the following. “Why did the technically impressive and far-reaching changes to the physical fabric of Puget Sound generate an equally enduring landscape of environmental injustice?”
Our short answer to Klingle’s question is that Seattle is home to the same kind of economic and social inequities seen throughout the United States. Urban geographer Richard Florida recently wrote about the US that “our cities, suburbs, and nation as a whole are splintering into a patchwork of concentrated advantage and disadvantage.” Seattle exemplifies this pattern. Expectedly, our research shows that despite the city’s improvement – overall – in mitigating pollution, low-income and minority groups do not enjoy these benefits and remain disproportionately exposed.
In other words, Seattle’s pollution riskscape and urban development burdens have been skewed toward some of the city’s most socially vulnerable residents. When one ignores or avoids these social and environmental injustices in Seattle, the city can be a magical and beautiful place. However, some neighborhoods in Seattle have fared poorly in all three dimensions of sustainability: environment, economy, and equity. A more just sustainability, instead of a segregating one, will require heightened political and policy attention to mitigate inequitable development and environmental injustice in Seattle and beyond.
Key References.
Abel, Troy D. 2008. “Skewed Riskscapes and Environmental Injustice: A Case Study of Metropolitan St. Louis.” Environmental Management 42(2): 232–48.
Abel, Troy D. and Jonah White. 2011. Skewed Riskscapes and Gentrified Inequities: Environmental Exposure Disparities in Seattle, WA. American Journal of Public Health 101(S1): S246–S254.
Abel, Troy D., Jonah White. 2015. Gentrified sustainability: inequitable development and Seattle’s skewed riskscape. Interdisciplinary Environmental Review 16(2/3/4): 124-157.
Abel, Troy D., Jonah White, and Stacy Clauson. 2015. Risky business: sustainability and industrial land use across Seattle’s gentrifying riskscape. Sustainability 7(11): 15718-15753.
